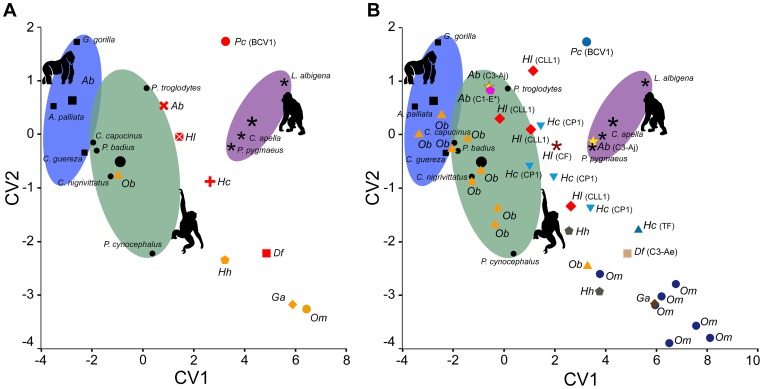
Figure 4. Results of the CVA based on three extant dietary categories and microwear variables.
(A) Results based on mean/species locality data and (B) on individuals. Colored ellipses denote the morphospace defined by each extant group, black symbols extant taxa (group centroids by larger symbols). Symbols and colors in a as in Figure 2, whereas in B symbols and colors are different to show variability within fossil species.

