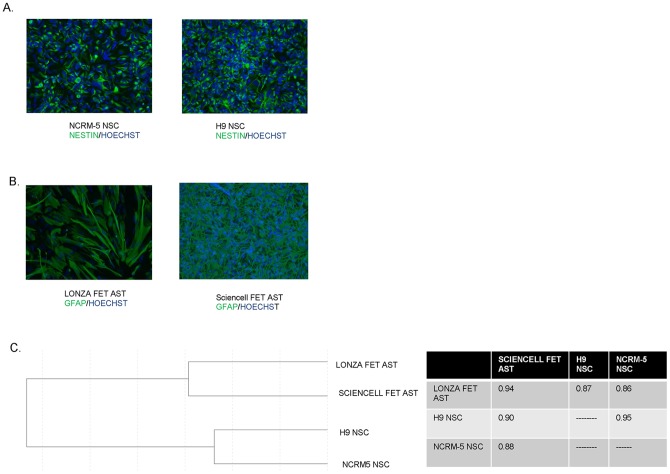
Figure 1. Characterization of NSC and fetal astrocyte samples.
(A) NCRM-5 iPSC derived NSCs and H9 ESC derived NSCs were examined for Nestin expression (green) which was overplayed with Hoechst nuclear stain (blue) to show all cells, (B) Lonza fet ast (fetal astrocytes) and Sciencell fet ast (fetal astrocytes) were examined for GFAP expression (green) which was overplayed with Hoechst nuclear stain (blue) to show all cells, (C) dendrogram showing relationship between NSCs and fetal astrocytes at the global gene expression level and a table showing correlation coefficients amongst all samples.

