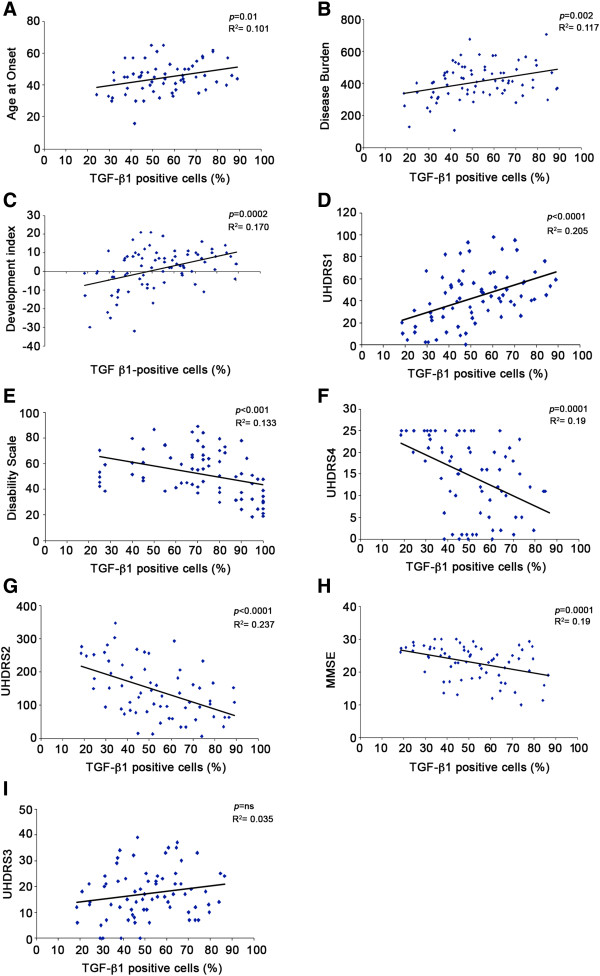
Figure 7.
Percentage of TGF-β1+ macrophages correlates with clinical and genetic parameters in HD individuals. Linear regression analysis showing positive correlation between percentage of TGF-β1+ cells and age at onset (A, n = 69), disease burden (B, n = 76), HD development index (C, n = 79) and UHDRS1 (D, n = 72). Percentage of TGF- β1+ macrophages negatively correlates with disability scale (E, n = 74), UHDRS4 (F, n = 70), UHDRS2 (G, n = 64), MMSE (H, n = 67). No correlation was observed between percentage of TGF-β1+ macrophages and UHDRS3 (I, n = 72). Each dot represents a single subject.

