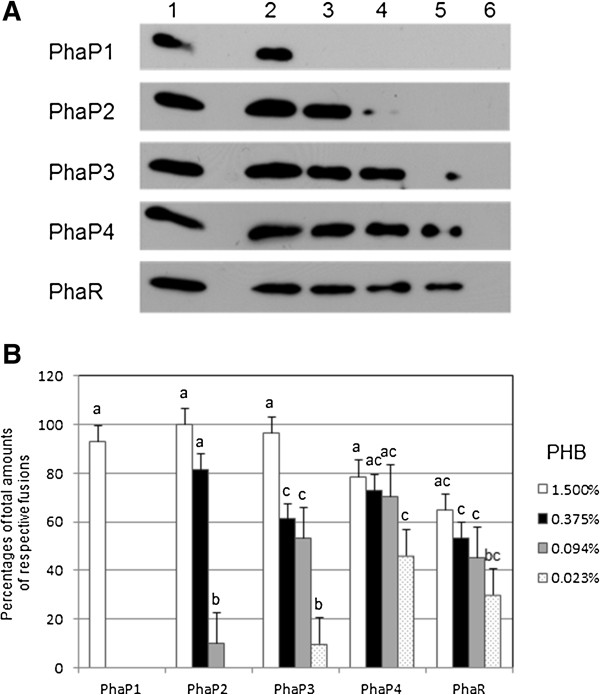
Figure 5.

PHB binding of His6-tag PhaP phasins and His6-tag PhaR in vitro. (A) Immunoblots to detect proteins contained in PHB/protein complexes. The amounts of target protein in the crude extracts were compared to controls, and then fixed to contain the same concentration of each of the His6-tag fusions of four PhaP phasins and PhaR. Target proteins were mixed with serially diluted suspensions of PHB, as a fine powder, in test tubes and incubated to allow formation of PHB/protein complexes. The PHB/protein complexes were spun down, washed to remove non-specific proteins, and then subjected to 18% SDS-PAGE followed by the immunoblot analysis as described in the Methods. Total crude extract in a tube (lane 1) and proteins contained in the PHB/protein complexes formed without (lane 6) and with 1.500% (w/v) (lane 2), 0.375% (lane 3), 0.094% (lane 4), and 0.023% (lane 5) PHB are loaded. One set of representative data, from three independent experiments with similar results, is shown. (B) Summary of PHB binding assay. Signal intensities on the immunoblots were quantified using ImageJ software [29] and defined as the parameters representing the amounts of the His6-tag fusion proteins on the blots. The amounts of His6-tag fusions contained in the PHB/protein complexes, formed without (lane 6 in panel A) and with 1.500% (w/v) (lane 2), 0.375% (lane 3), 0.094% (lane 4), and 0.023% (lane 5) PHB, are expressed as percentages of total amounts of respective fusions (lane 1). Values are means of three independent results ± SD, and those followed by the same letters are not significantly different at the 95% confidence level.
