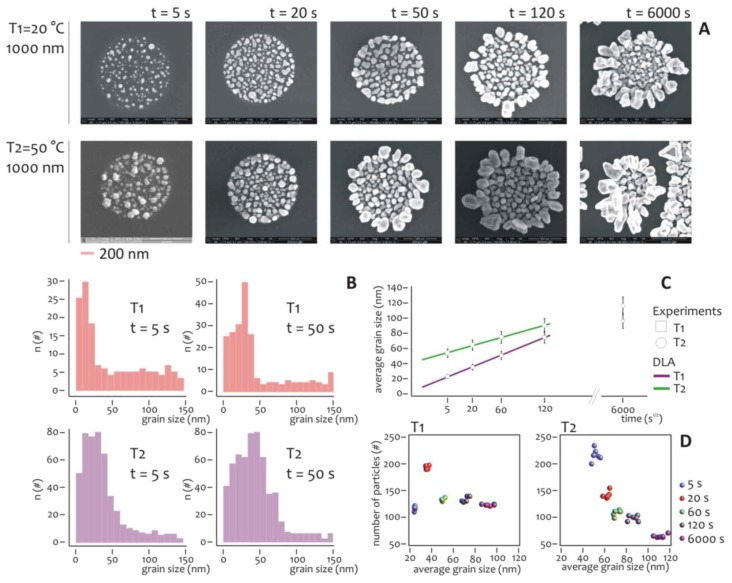
Figure 3.
The effect of temperature and time of deposition on the characteristics of the aggregates of nano-particles. In (A), the SEM micrographs of the nano-particles aggregate, taken at low T1 = 20 °C and high T2 = 50 °C temperature, reveal the evolution of the growth front of silver with time (A). The cited SEM images can be conveniently processed and used to extract quantitative information of the clusters morphology. The average grain size distribution is reported in (B) for the limiting cases T1 = 20 °C, T2 = 50 °C, and for the time steps t = (5, 50) s. Complementary to this, the diagram in (C) reports the average grain size as a function of the square root of time, where a linear dependence between those variables is revealed, and this is consistent with the growth of particles in a diffusive regime. In (D), a scatter plot shows the number of particles as a function of particles size, for the time of the process of deposition varying between 5 and 6,000 s, for the fixed temperatures T = (20 °C, 50 °C). Incidentally notice how, at high temperature, the system is more sensitive to time, than at low temperature.

