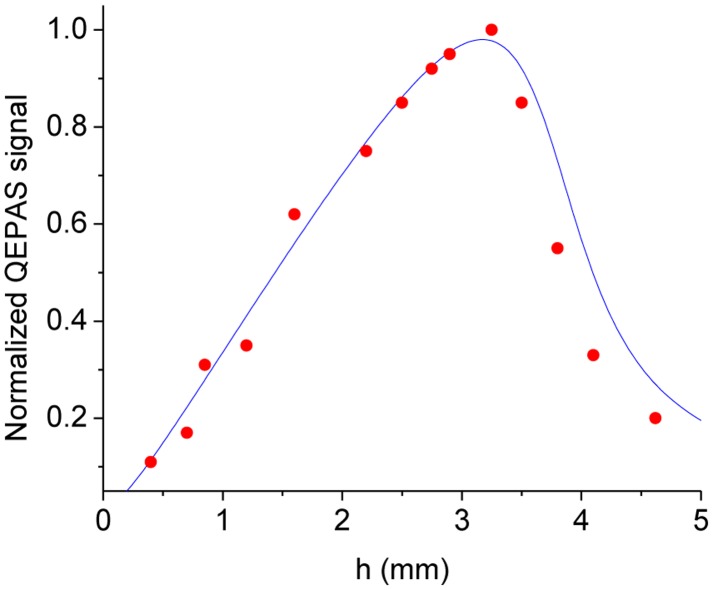
Figure 8.
Normalized experimental results (dots) of the QEPAS signals as a function of the vertical position of the QTF. Data are obtained by detecting a concentration of 2% H2O in N2 at 75 Torr and by using an on-beam QEPAS sensor system configuration. The solid line is the best fit curve obtained using Equation (3.21).

