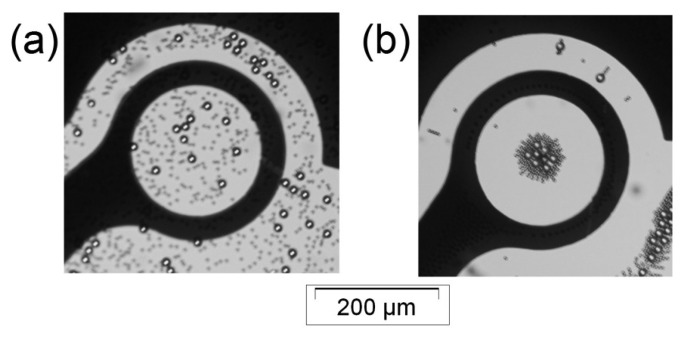
Figure 5.
The manipulation of 5 and 15 μm particles under DEP field. The figure shows 5 μm particles (seen as the black points) and 15 μm particles (seen as the white circles) (a) before applying a non-uniform electric field (both sizes of microparticles were homogenously mixed and uniformly distributed) and (b) after applying 500 kHz signal (n-DEP on both microparticles).

