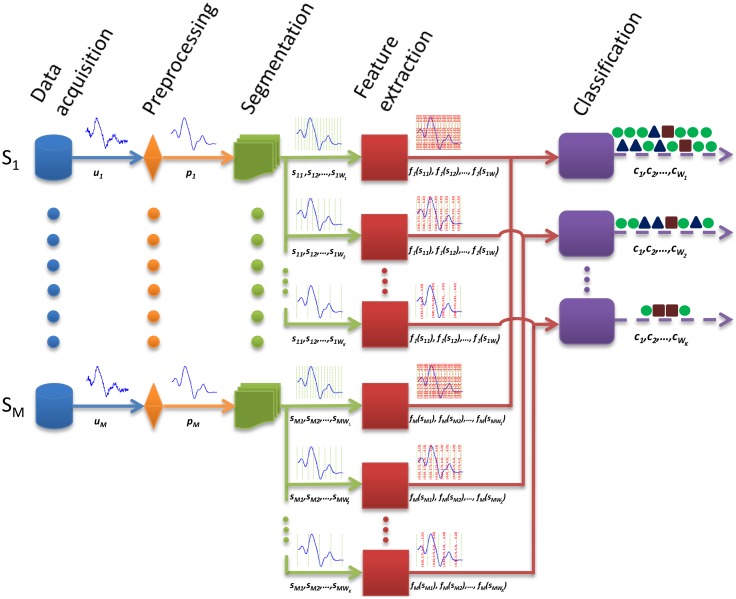
Figure 2.
Different stages of the activity recognition chain (ARC). An example of the correlation of the windowing approach and subsequent levels of the ARC is shown. Here, different window sizes are depicted particularly. Concretely, M sensors deliver raw signals (u1, u2, …, uM), which are subsequently processed (p1, p2, …, pM). The signals are partitioned into data windows of size Wk (e.g., s1Wk, s2Wk, …, sMWk). For each window, k, a set of features are extracted and aggregated in a single feature vector (f1(s1Wk), f2(s2Wk), …, fM(sMWk)) that is used as the input to a classifier. The classifier yields a class (cWk) that represents the identified activity.

