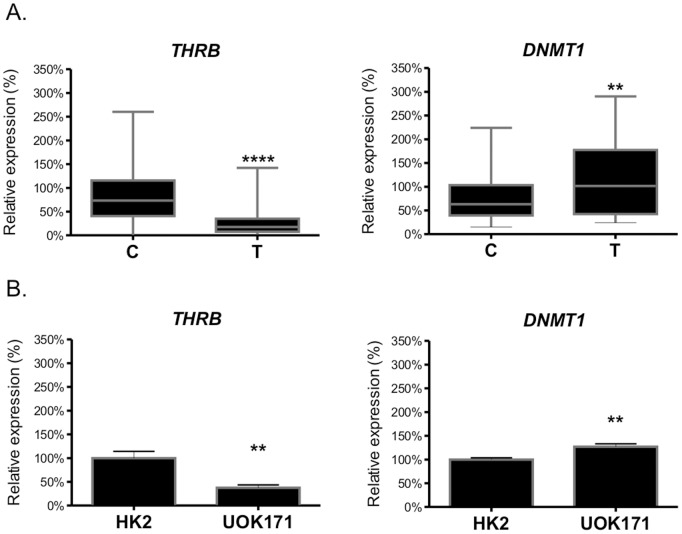
Figure 1. The expression of THRB and DNMT1 in renal cancer.
A. THRB and DNMT1 mRNA expression in tissue samples: non-tumorous controls (C, n = 35) and paired ccRCC samples (T, n = 35). The data are shown as percent of control (C). Real-time PCR for each sample was performed in triplicates. Statistical analysis was performed using Wilcoxon matched pair test. **** p<0.0001. B. The expression of THRB and DNMT1 mRNA in cell lines: HK2: proximal tubular cell line derived from normal kidney, UOK171: ccRCC cell line derived from IV stage tumor, spontaneously immortalized. The plots show results of five independent biological experiments, measured in triplicates. Statistical analysis was performed using t-test. ** p<0.01.

