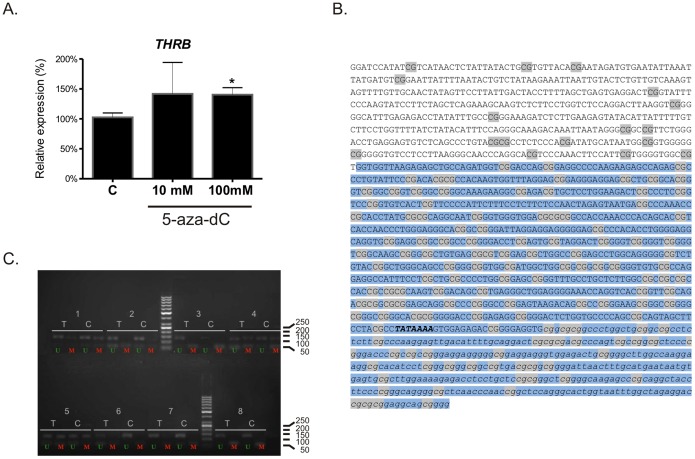
Figure 2. Analysis of THRB CpG methylation.
A. The effect of 5-aza-2′ deoxycytidine (5-aza-dC) on THRB mRNA expression in UOK171 cell line. The results are shown as percent of control (the cells cultured without 5-aza-dC supplementation). The plot shows results of three independent biological experiments, measured in triplicates. Statistical analysis was performed using t-test. *p<0.05. B. The sequence of THRB gene with the promoter region (GenBank Acc.no. KF669869). CpG island, encompassing the promoter and 1st exon (region −873 to +355) is shadowed blue. TATA box is bolded. CpG dinucleotides are shadowed gray. Lower case letters indicate 1st exon of the TRβ transcript. C. Representative electrophoretic analysis of MSP-PCR. U: PCR products obtained with primers specific to unmethylated sequence; M: PCR products obtained with primers specific to methylated sequence. C: control samples, T: tumor samples.

