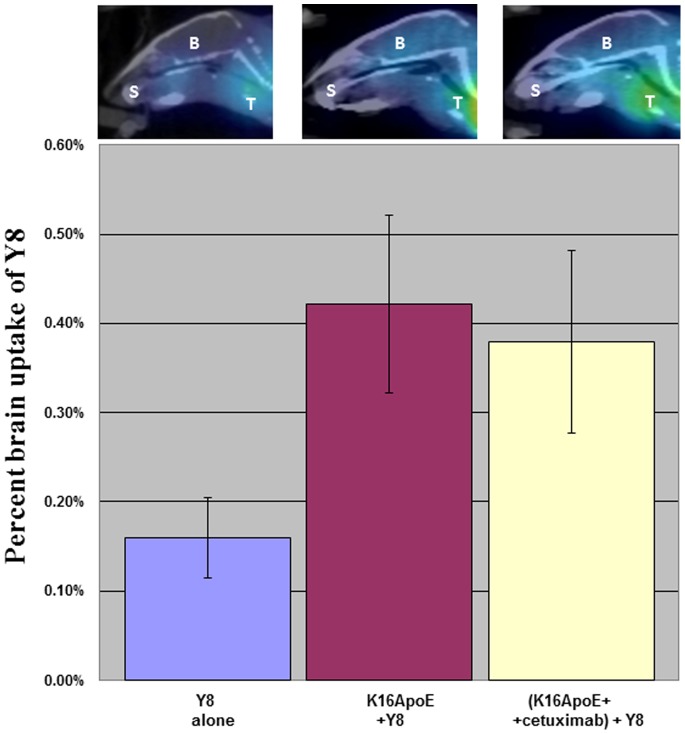
Figure 4. Brain imaging and quantification (via microSPECT) of brain-uptake of Y8 delivered via K16ApoE.
I-125labeled Y8 was delivered to the brain by first injecting K16ApoE then injecting Y8 as described earlier. Brain delivery of Y8 was also assessed after injection of a mixture of K16ApoE and cetuximab (300 ug of each). A. The bars represent brain uptake of I-125labeled Y8 when injected by itself (blue), injected after injection of K16ApoE (majenta) or injected after injection of a mixture of K16ApoE and cetuximab (yellow). Six mice were evaluated for each group. Images of brains by microSPECT representing delivery of I-125labeled Y8 at different conditions are presented on top of the bars. Brain images were taken after cardiac perfusion with saline. T- thyroid gland; S – salivary gland; B- brain.

