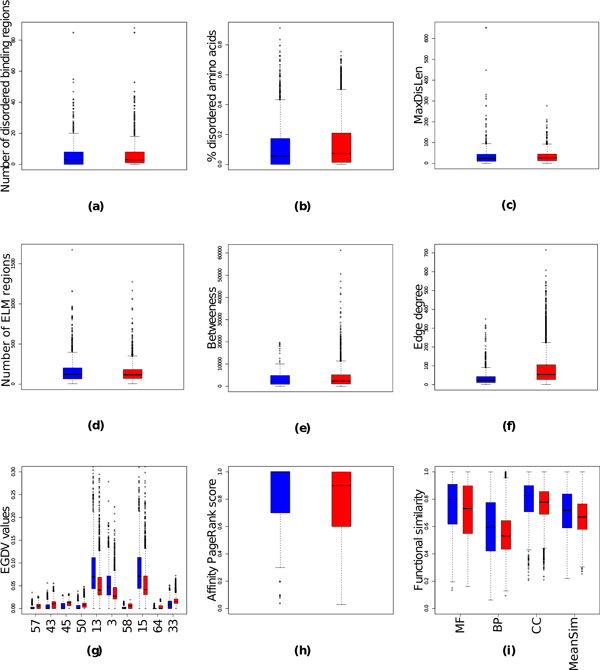
Figure 4.
Boxplot distributions of features in simultaneously possible (red) and mutually exclusive (blue) interactions. For the number of disordered binding regions, the fraction of disordered amino acids, and the number of found ELM both values for protein A and B are combined into one distribution. For EGDV (g) only top 10 features with the lowest P value are plotted.

