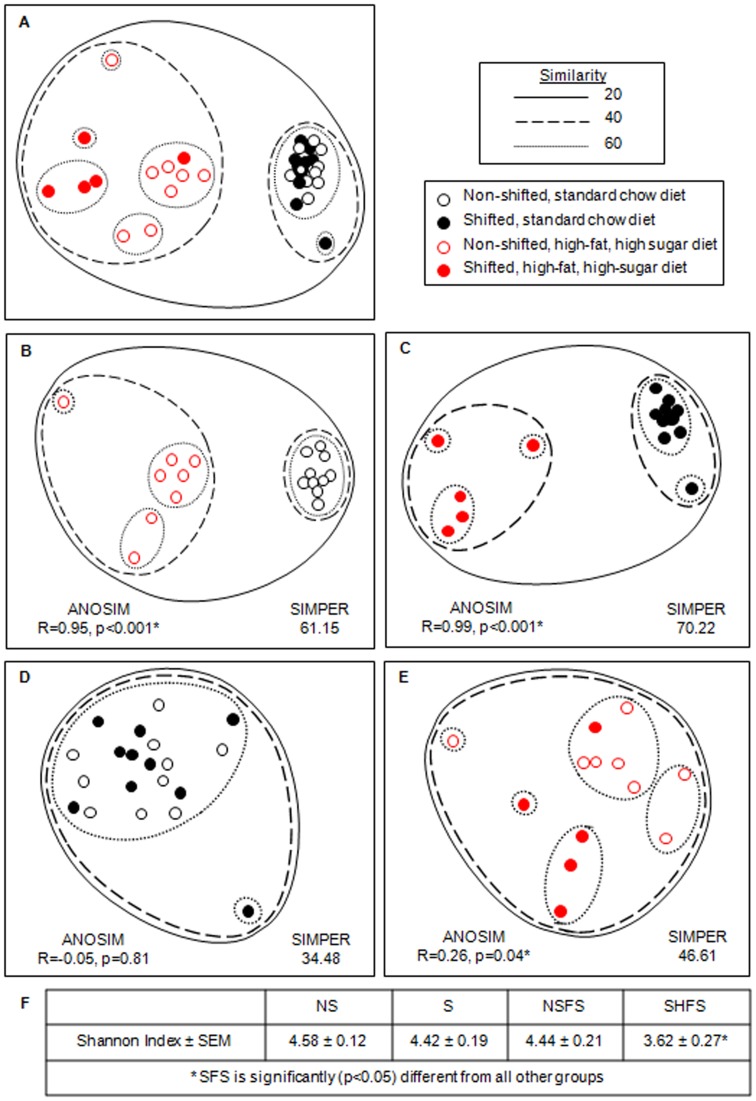
Figure 2. Effect of diet and circadian rhythm disruption on mouse gut microbial communities.
The non-metric multidimensional scaling (NMDS) plot demonstrates the effect of treatments on the overall mouse fecal microbial community structure, as assessed by bacterial small subunit ribosomal RNA gene amplicon sequencing . The NMDS plot is based on sample-standardized and square-root transformed abundance data. The NMDS plot and the hierarchical cluster overlay are based on a resemblance matrix calculated using S17 Bray-Curtis similarity. 2D stress values ranged from 0.04 to 0.17. ANOSIM: Analysis of similarities. SIMPER: Similarity percentages.

