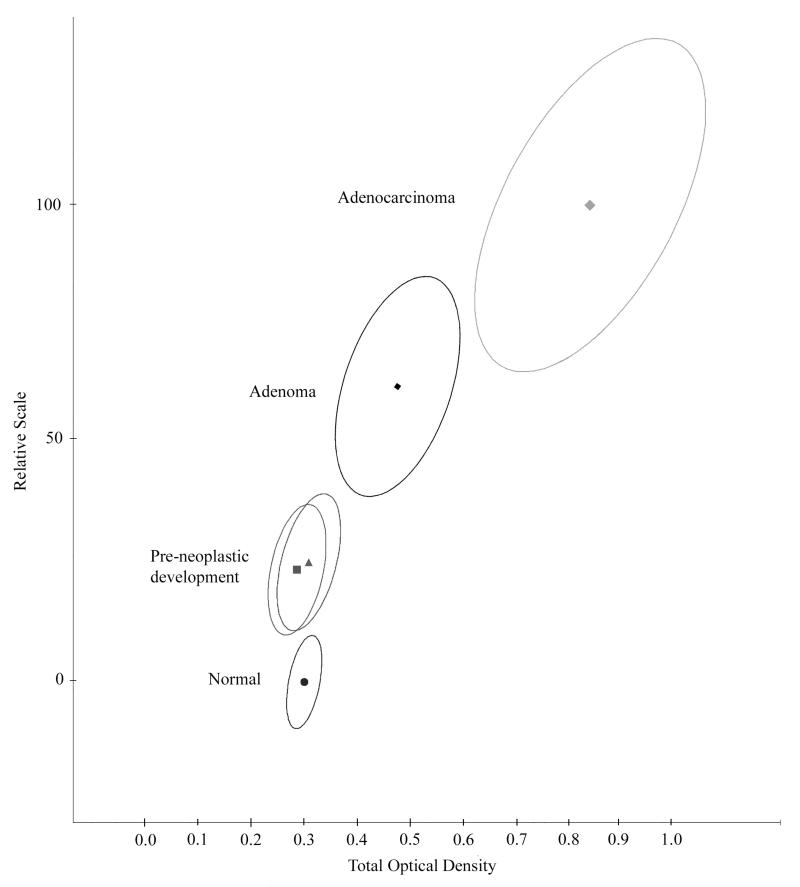
Figure 3.
Progression in colonic lesions plotted on a relative scale from zero (mean of zero for nuclei from normal tissue) to 100 (mean for nuclei from adenocarcinoma). Shown are the bivariate mean vectors, and the 95% confidence ellipses for nuclei. The nuclei sampled in histologically normal-appearing tissue from cases harboring an adenoma or an adenocarcinoma lesion (norm/lesion) fall into the same region along the progression curve, between the nuclei from normal tissue ( norm/norm) and from adenoma.

