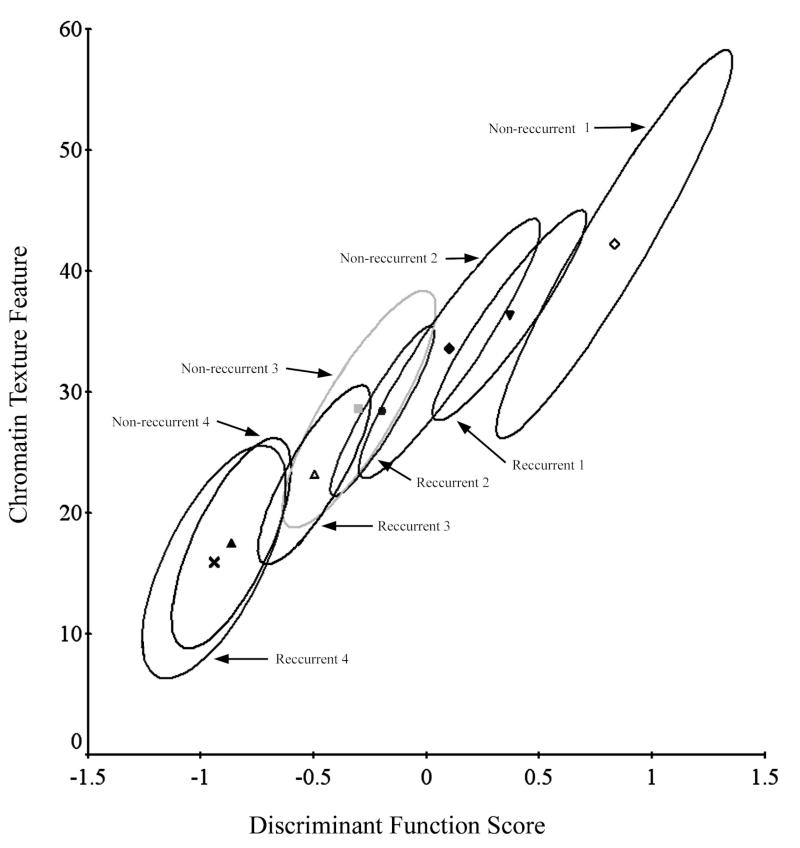
Figure 7.
Processing of the remaining data by the non-supervised learning algorithm P-index. The algorithm formed four clusters each for the recurrent and the non-recurrent cases. The clusters correspond to each other. For the clusters NR1 and R1 a diagnostically useful separation is seen--the prognostically interesting information is expressed in only a subset of the data.

