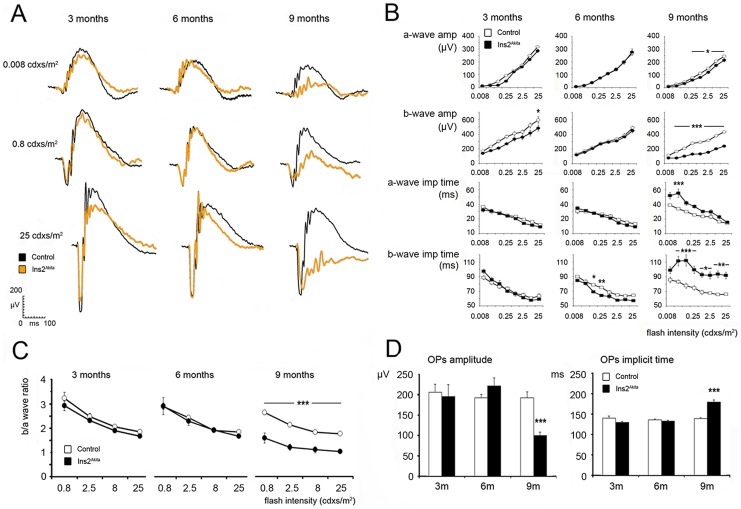
Figure 1. Abnormal scotopic electroretinogram (ERG) responses in the Ins2Akita mouse.
(A) Representative scotopic ERG responses obtained from control (black) and Ins2Akita mice (orange) of different ages. (B) The amplitude (µV) and implicit time (milliseconds, ms) of the dark adapted a- and b-waves in control and Ins2Akita mice. (C) The b/a-wave ratio in different ages of control and Ins2Akita mice. (D) The amplitude and implicit time of oscillatory potentials in control and Ins2Akita mice. (B-D) n = 6 mice per strain/age, *P<0.05, **P<0.01, ***P<0.001. 2-way ANOVA (a- and b-wave responses), Student's t-test (OPs responses).

