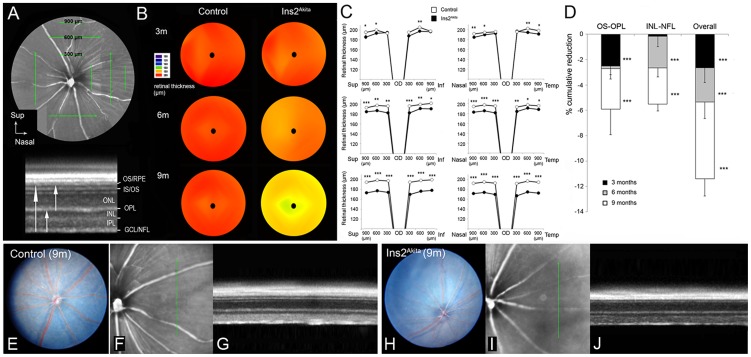
Figure 2. Retinal degeneration in the Ins2Akita mouse.
(A) SD-OCT image from 9-month old control retina. Retinal thickness was measured at 300, 600 and 900 µm eccentricities in dorso-ventral and nasal-temporal retinal regions, from NFL-OS (total retinal thickness), NFL-INL (inner retinal thickness) and OPL-OS (outer retinal thickness). Isodensity maps (B) and quantitative analysis (C) of total retinal thickness from control and Ins2Akita mice at different ages. (D) The cumulative reduction of outer, inner and total retinal thickness in different ages of control and Ins2Akita mice. Fundus (E, H) and OCT images (F-G, I-J) taken from 9-month old control (A-C) and Ins2Akita mice (D-F). (B-D) n = 6 mice per strain/age, *P<0.05, ** P<0.01, *** P<0.001 compared to control mice of the same age. Student's t-test. RPE, retinal pigment epithelium; IS/OS, photoreceptor inner/outer segments; ONL, outer nuclear layer; OPL, outer plexiform layer; INL, inner nuclear layer; IPL, inner plexiform layer; GCL/NFL, ganglion/nerve fibre layer.

