
Figure 1.
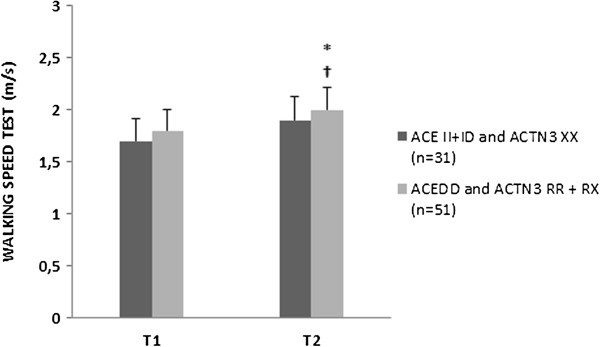
Walking velocity test at the beginning of the protocol (T1) and after 12-weeks (T2). Data presented are mean ± SD. *Significantly different (P ≤ 0.05) between T1 and T2 weeks; †Significant changes (P ≤ 0.05) between the groups.
Official websites use .gov
A
.gov website belongs to an official
government organization in the United States.
Secure .gov websites use HTTPS
A lock (
) or https:// means you've safely
connected to the .gov website. Share sensitive
information only on official, secure websites.
Walking velocity test at the beginning of the protocol (T1) and after 12-weeks (T2). Data presented are mean ± SD. *Significantly different (P ≤ 0.05) between T1 and T2 weeks; †Significant changes (P ≤ 0.05) between the groups.