Figure 2.

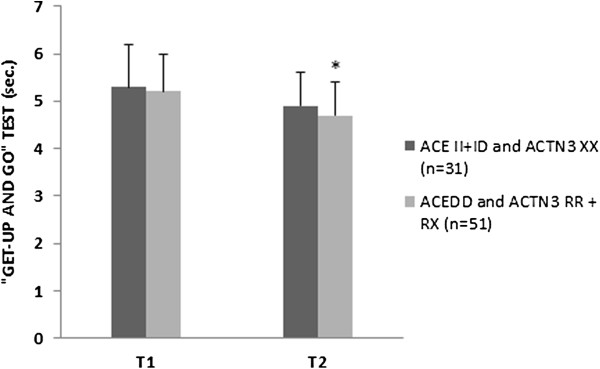
“Get-up and go” test at the beginning of the protocol (T1) and after 12-weeks (T2). Data presented are mean ± SD. *Significantly different (P ≤ 0.05) between T1 and T2 weeks; †Significant changes (P ≤ 0.05) between the groups.

“Get-up and go” test at the beginning of the protocol (T1) and after 12-weeks (T2). Data presented are mean ± SD. *Significantly different (P ≤ 0.05) between T1 and T2 weeks; †Significant changes (P ≤ 0.05) between the groups.