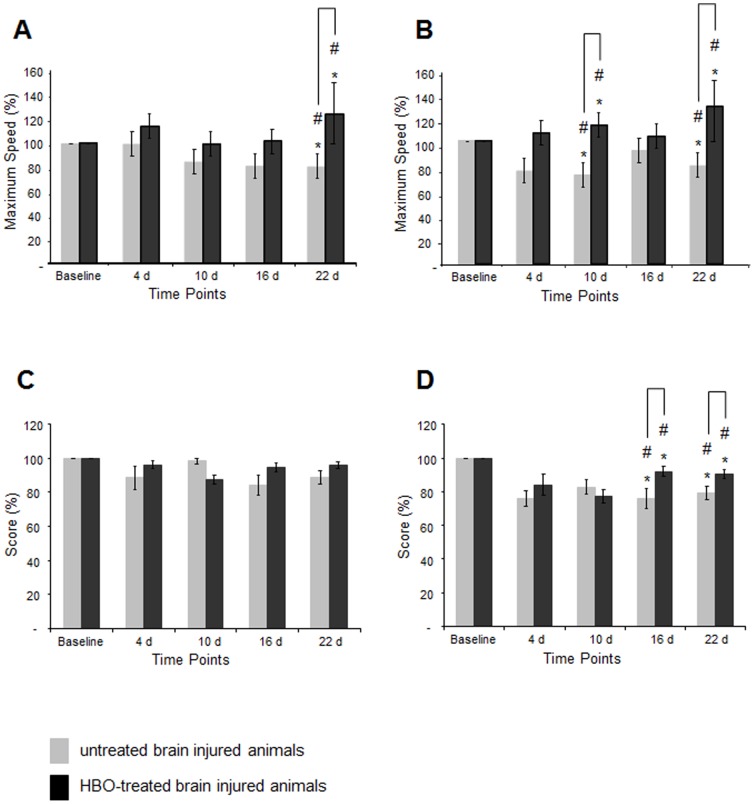
Figure 6. Time-dependent modulations of sensorimotor function following traumatic brain injury and HBO treatment.
A: percentage of maximal speed output on the Rotarod of HBO-treated and untreated animals following moderate brain injury as compared to baseline performance; B: percentage of maximal speed output on the Rotarod of HBO-treated and untreated animals following severe brain injury as compared to baseline performance; C: percentage modulation in the composite neuroscores of HBO-treated and untreated animals following moderate brain injury as compared to baseline performance; D: percentage modulation in the composite neuroscores of HBO-treated and untreated animals following severe brain injury as compared to baseline performance; squares: untreated brain injured animals; circles: HBOT-treated brain injured animals; *p<0.02 (repeated measures mixed model ANOVA, F(1,24) = 7.00, p<0.02); # p<0.05 (t-test); Rotarod: n≥7 for each of the moderately injured groups, untreated and HBO-treated; n = 13 for each severely injured group, untreated and HBOT-treated; Composite Neuroscore: n≥11 for each group, moderately or severely injured animals with or without HBO treatment. (Note that uneven group sizes arise from missing data points in some animals, which were excluded in repeated measures mixed model ANOVA). Error bars represent ± standard error means.

