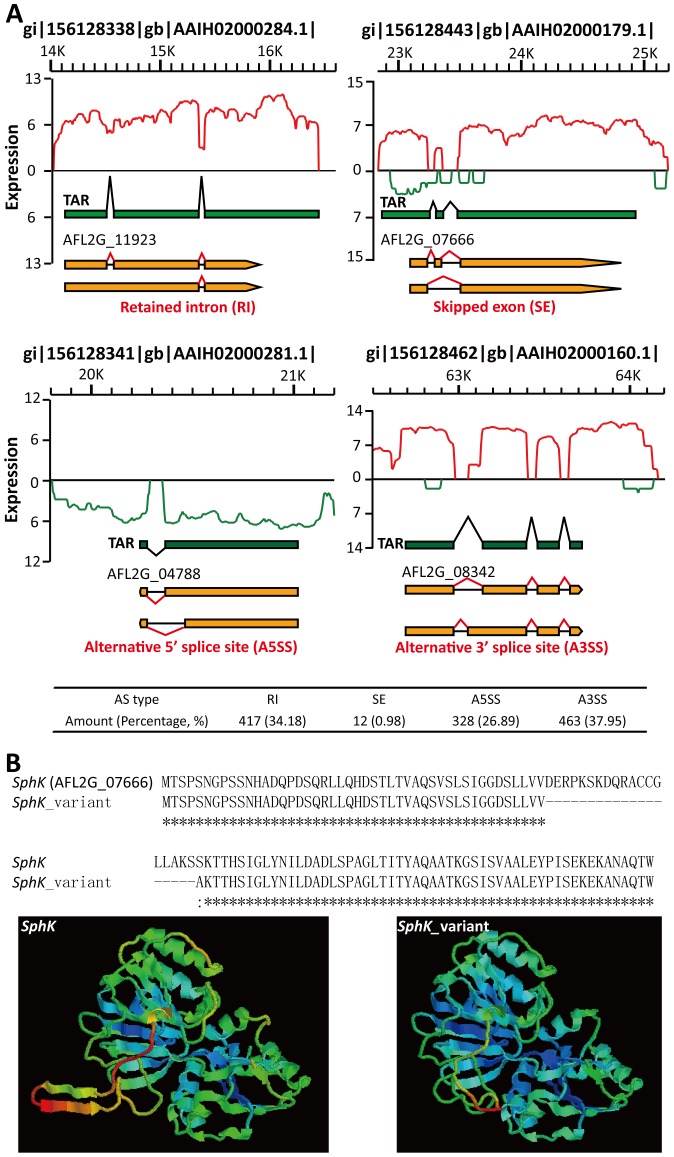
Figure 4. Illustration of AS events (RI, SE, A5SS and A3SS) identified in the A. flavus transcriptome.
(A) Green bar, the transcriptional active region (TAR). Orange bar, A. flavus annotated genes. Knuckle lines (black or red), the relation with TARs or exons. The types and amounts of AS events are shown. (B) Amino acid alignment and homologous 3D modeling of AFL2G_07666 (SphK) and its AS variant (SphK _variant). Broken line, the skipped exon of SphK.

