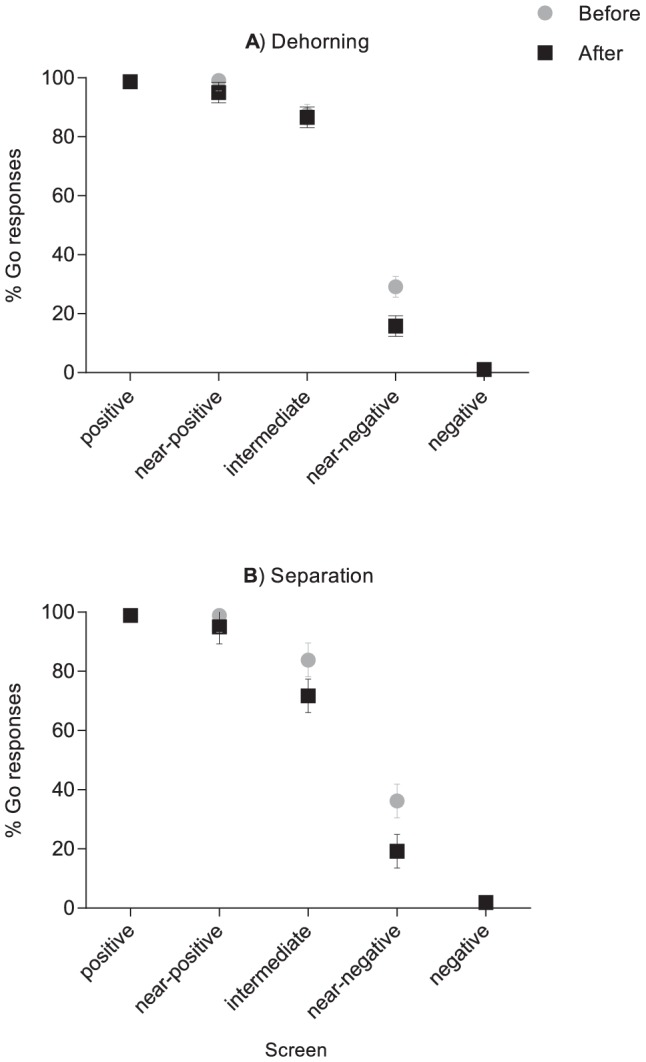
Figure 1. Mean±SE % GO responses to screens presented during test sessions before and after a) dehorning (n = 12 calves) and b) separation from the dam (n = 8 calves).

Responses are shown separately for the two training screens (positive and negative) and for the three ambiguous probe screens (near-positive, intermediate and near-negative).
