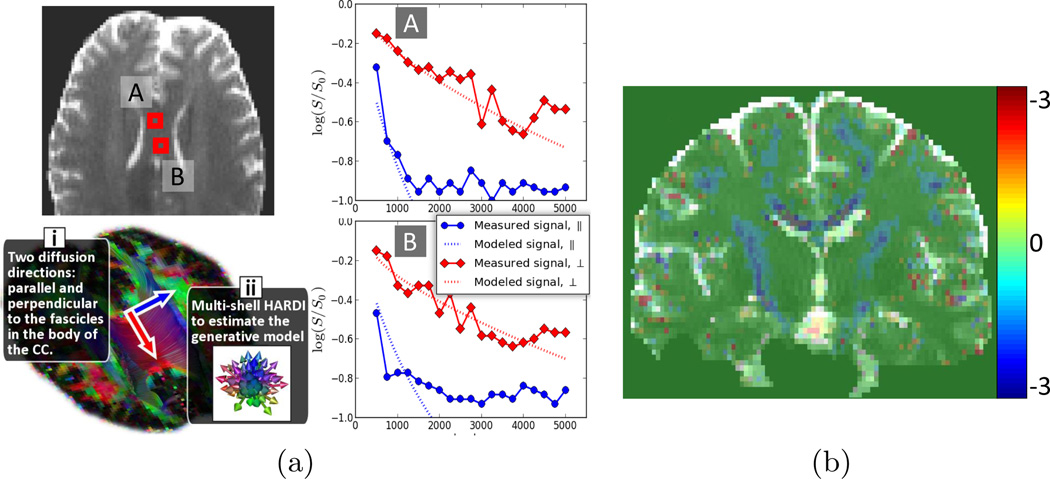
Fig. 2.
(a) Plots of log(Sk/S0). Our model captures the non-monoexponential decay observed in a region of a single fascicle direction. Note that the plotted data points were not used for the model estimation. (b) Cross-testing evaluation: difference between the mean-square prediction error of DIAMOND and MTM (lower is better).

