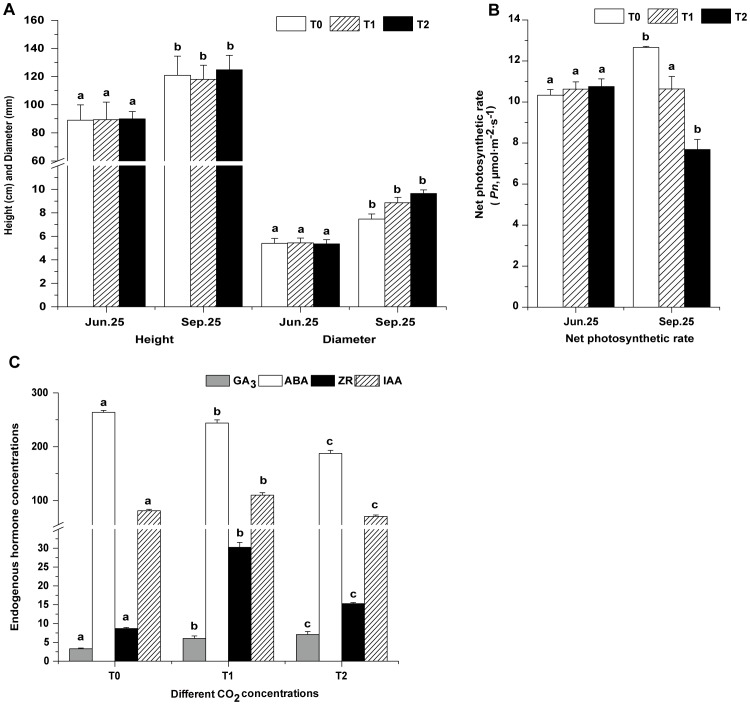
Figure 1. Changes in growth, net photosynthetic rate and endogenous hormones at different CO2 concentrations.
The three CO2 concentrations were: T0 treatment (385 µmol·mol−1 CO2, day 25°C/night 20°C); T1 treatment (550 µmol·mol−1 CO2, day 28°C/night 23°C); and T2 treatment (720 µmol·mol−1 CO2, day 31°C/night 26°C). A. Growth parameters of height and diameter of trees measured on June 25 and September 25 at different CO2 concentrations. Bars represent SE (n = 20). B. Net photosynthetic rates of leaves sampled on June 25 and September 25. C. Levels of four endogenous hormones [gibberellic acid (GA3, ng/g), abscisic acid (ABA, ng/g), zeatin riboside (ZR, ng/g), and indole acetic acid (IAA, µg/g)] in leaves sampled on September 25 at different CO2 concentrations. The unit of four hormone concentrations is in fresh weight. Bars represent SE (n = 30 for net photosynthetic rates; n = 9 for endogenous hormone concentrations). Different letters on columns with the same pattern indicate differences at P<0.05 according to the LSD test.

