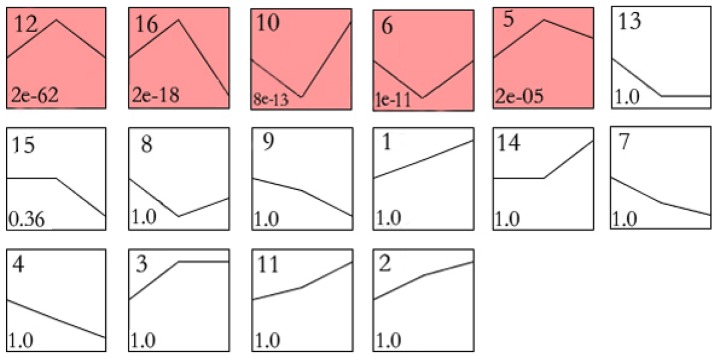
Figure 2. Cluster analysis of expression profiles of 5,127 differentially expressed genes.
There were sixteen profiles for differentially expressed genes under elevated CO2 concentrations. Each box represents an expression profile. The upper number in the box is the profile number and the lower shows the P-value. Colored squares indicate significant profiles (P<0.05).

