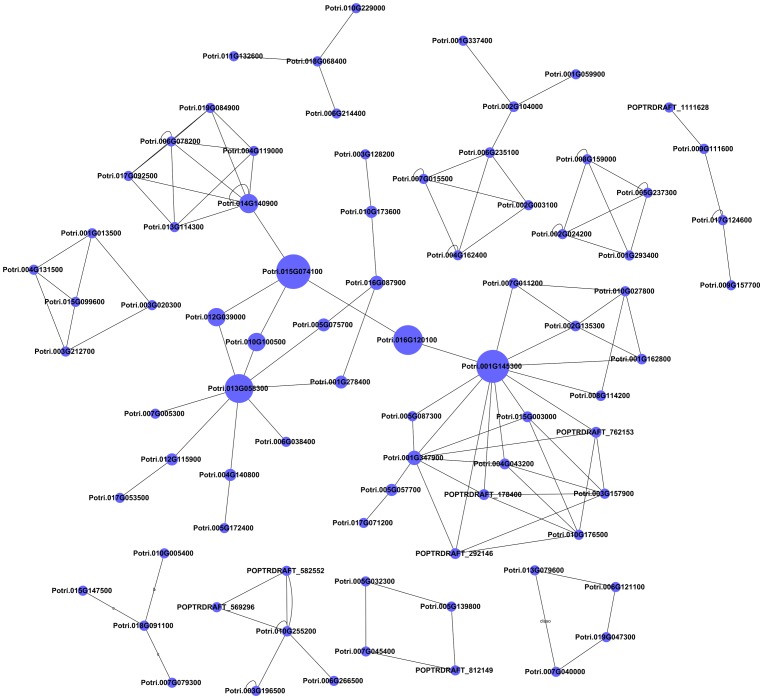
Figure 5. Signal transduction network of differentially expressed genes under different CO2 concentrations.
Cycle nodes represent genes, the sizes of nodes represent the power of the interrelation among the nodes, and the edges between two nodes represent interactions between genes. Details of genes that mapped to each cycle node are listed in Table S4.

