
Figure 5. Sex Differences in the Left Superior Longitudinal Fasciculus and Right Uncinate Fasciculus.
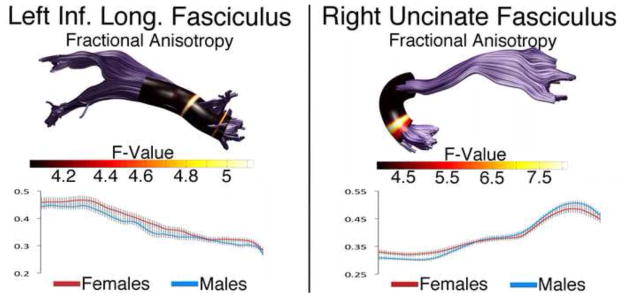
Tract profiles illustrating sex differences in FA along the left ILF and right uncinate in typically developing male and female children. Color bar indicates F statistic values from Bonferroni-corrected analyses of covariance conducted at each location along the tracts length. Significant comparisons are indicated by non-black regions. Corresponding plots for FA in males and females are presented below each tract profile.