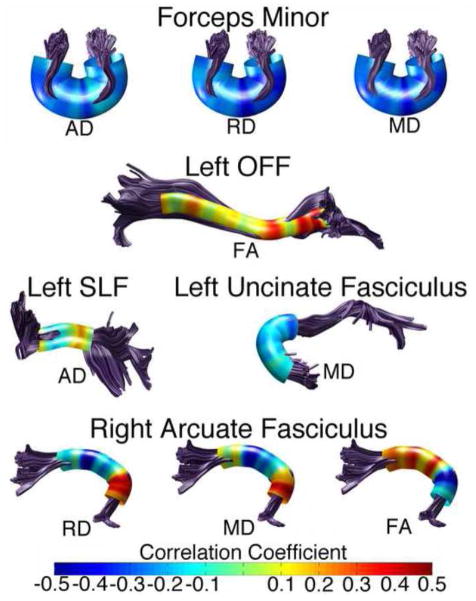
Figure 6. Relationship Between Participant Age and Diffusion Parameters in Several Tracts.
Tract profiles illustrating partial correlations between age and various diffusion parameters in tracts where age emerged as a significant covariate. Scanner type and handedness are controlled. Correlation strength was variable along the tract. Colors represent the strength of the relationship as indicated by r-values. Warmer colors indicate a positive relationship and cooler colors indicate a negative one.

