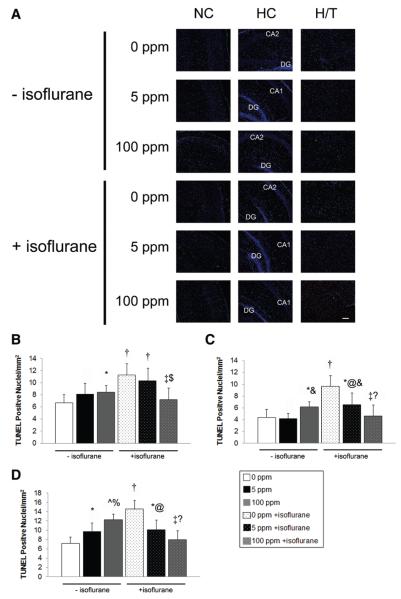
Figure 3.
Apoptosis after carbon monoxide (CO) exposure with and without isoflurane. TUNEL assays were performed on coronal sections 5 hours after exposure. (A) Representative sections imaged at ×10 from somatosensory neocortex (NC), hippocampus (HC), and hypothalamic/thalamic region (H/T) obtained after 1-hour exposure to air (0 ppm CO), 5 ppm CO, or 100 ppm CO with (+) and without (−) isoflurane are depicted. Green TUNEL positive nuclei are visible. CA1, CA2, dentate gyrus (DG) regions of HC are labeled. Scale bars, 100 μm. Quantification of total TUNEL positive nuclei from NC, HC, and H/T in 3–4 nonserial coronal sections are demonstrated in (B) neocortex (C) hippocampus and (D) hypothalamic/thalamic region. Values are expressed as means plus standard error. N = 3–4 animals per cohort. *P < 0.05 vs 0 ppm CO − isoflurane. †P < 0.01 vs 0 ppm CO − isoflurane. ^P < 0.001 vs 0 ppm CO − isoflurane. @ P < 0.05 vs 0 ppm CO + isoflurane. ‡P < 0.01 vs 0 ppm CO + isoflurane. % P < 0.05 vs 5 ppm CO − isoflurane. &P < 0.01 vs 5 ppm CO − isoflurane. $P < 0.05 vs 5 ppm CO + isoflurane.?P < 0.05 vs 100 ppm CO − isoflurane.

