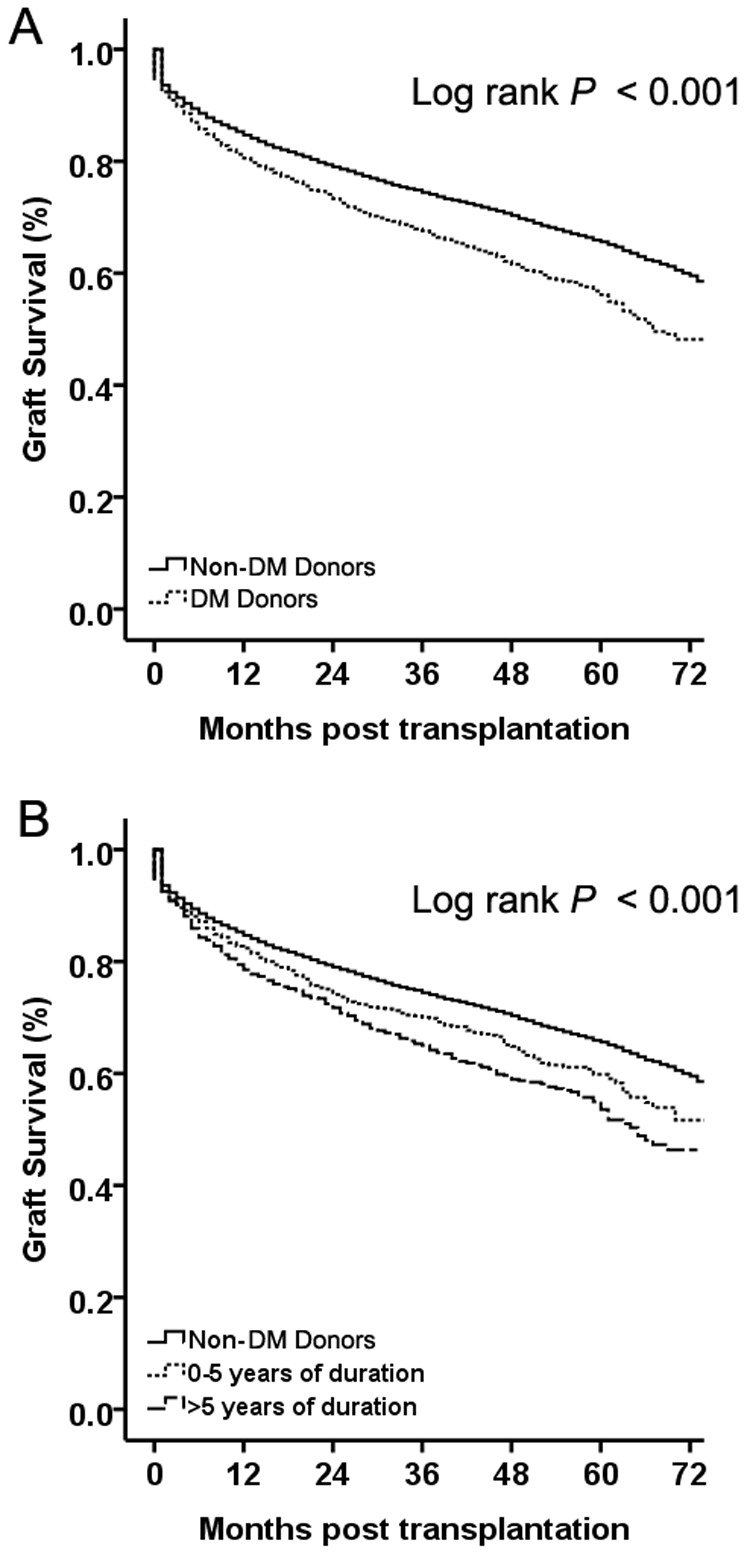
Figure 1. Kaplan–Meier survival curves comparing overall graft survival and graft survival stratified by donor duration of diabetes mellitus (DM) history in recipients from DM and non-DM donors.

A) Overall graft survival in recipients from DM and non-DM donors. Recipients with DM donors had significantly lower survival. (B) Graft survival by the duration of DM in the donor. Recipients of liver grafts from DM donors with durations of DM >5 years had significantly lower survival compared with those with durations of DM <5 years and recipients from non-DM donors. Continuous line depicts recipients from DM donors and dashed line depicts recipients from non-DM donors.
