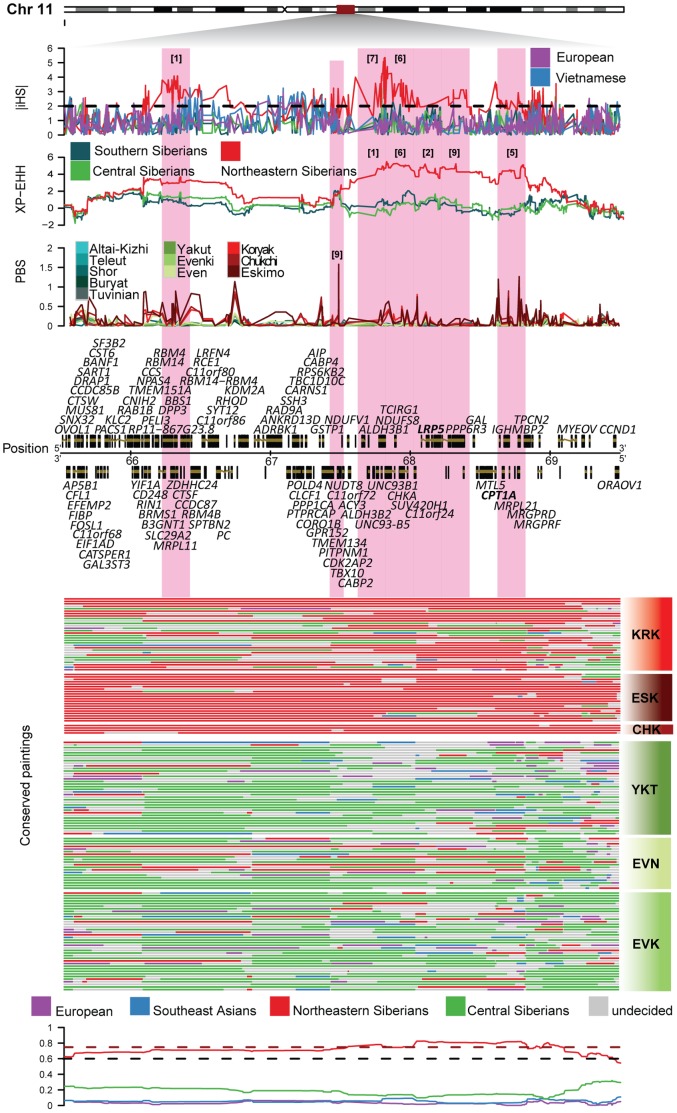
Figure 2. Zooming on the region on chromosome 11 that showed the strongest signals in the Northeastern Siberian populations.
The |iHS|, XP-EHH and PBS scores that showed strong signals (amongst top 10 ranking windows) in the Northeastern Siberian populations are shown in the upper panels for the different Siberian populations. The pink highlights mark the windows present in the top 10 ranking windows in the Northeastern Siberian populations. The rankings are marked on the respective windows in the respective test panels. Protein-coding genes present in the 4 Mb region are shown under the test plots with the genes present in our predefined cold adaptation list marked in bold font (CPT1A and LRP5). The position on the chromosome is given in Mb. The paintings of the phased chromosomes for the region in the Northeastern and Central Siberian individuals are shown underneath the Position legend. The aggregated ancestral probabilities from ChromoPainter for the Northeastern Siberian individuals are displayed below the paintings. The dotted red line shows the threshold for the upper 5% tail (0.75) and the black dotted line shows the mean of the genome-wide probabilities distribution of the Northeastern Siberian ancestor (red).

