
Figure 3. Conformational sampling of decoys for the target 1kviA, using the adaptive and static T-ReX simulation methods.
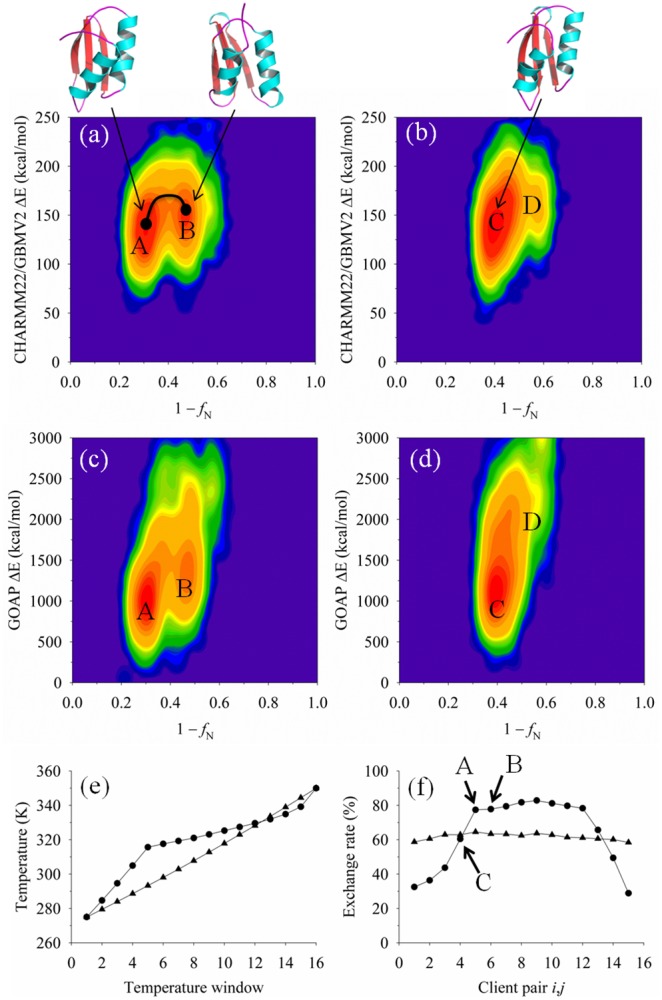
Figures 3a–d show population-density profiles culled at 275 K from the trajectories generated by the two simulation methods. The energy functions CHARMM22/GBMV2 and GOAP are plotted as a relative change (ΔE) from a minimum value for each function versus the computed fraction of native contacts (f N). Population-density contours are displayed using a logarithmic distribution where the color range denotes the free-energy scale from high probability (red color) to low probability (blue color). Several highly populated energy basins are labeled in the profiles with representative conformers. Figure 3e shows the replica temperature windows (16 clients) as a function of the computed temperature at the end of 20 ns simulation time. Results from the adaptive method are shown as circle symbols and the static (geometrically fixed) temperatures as diamonds. Figure 3f reports the final replica exchange rate for each client pair i,j at 20 ns simulation time. Symbols of Fig. 3f are the same as given in Fig. 3e. Several basins highlighted in figures a-d are denoted by their client representation.