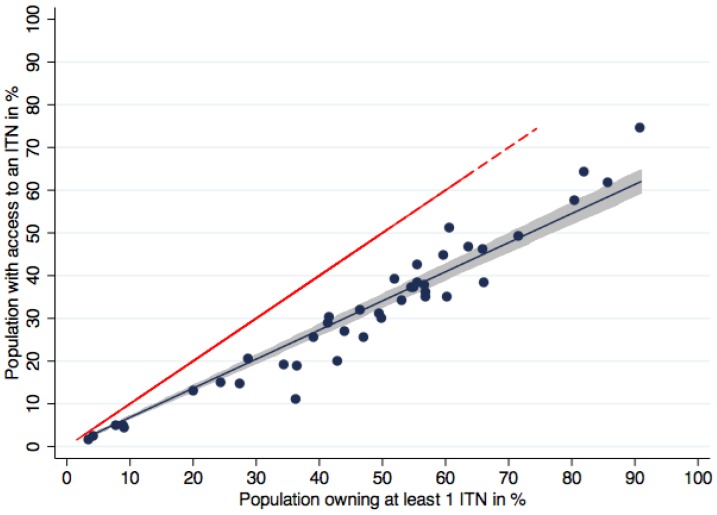
Figure 2. Population with access to an ITN within the household compared to ownership of at least one ITN.
Blue dots represent the data points for data sets, the blue line the regression function (fitted values). Shaded area is the 95% confidence interval of the fitted values of population with access to an ITN within the household. Red dashed line represents the equity line where ownership is equal to access. On average, population access was 32% lower than household ownership.

