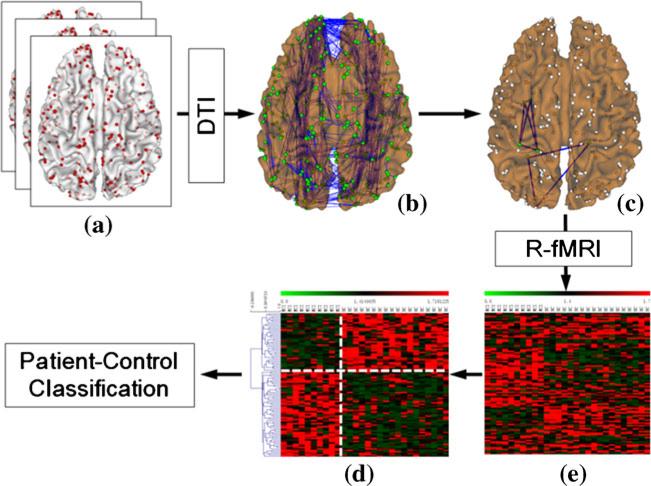
Fig. 1.
The overview of our study. a Cortical ROIs (red dots) localized via DICCCOL system for each subject. b Structural connectomes constructed from fiber tracts derived from DTI tractography. c Examples of structural cliques (complete sub-graphs) (purple polygons) serving as the structural substrates of sub-networks for evaluating the FGFIs. d Significantly altered FGFIs in patients. e FGFI signatures. The vertical white dashed line separates patients and controls, while the horizontal dashed white line separates significantly increases and decreased FGFIs in patients

