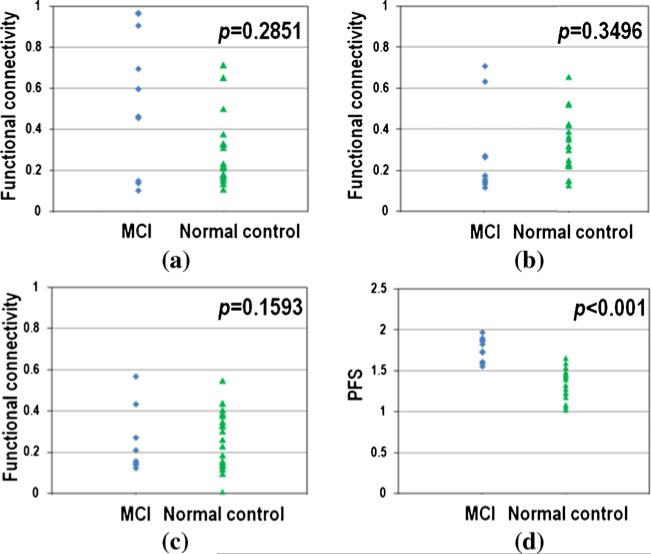
Fig. 7.
The distribution of inter-regional functional connectivities and PFSs for an exemplar 3-node clique that has significantly different PFS but has no significantly different inter-regional functional connectivities between MCI and normal controls. a, b and c shows inter-regional functional connectivity for the three edges of the clique, respectively. d shows the PFSs on the clique. p-value of significance test (two-tailed t-test) is at the right-top corner in each sub-figure

