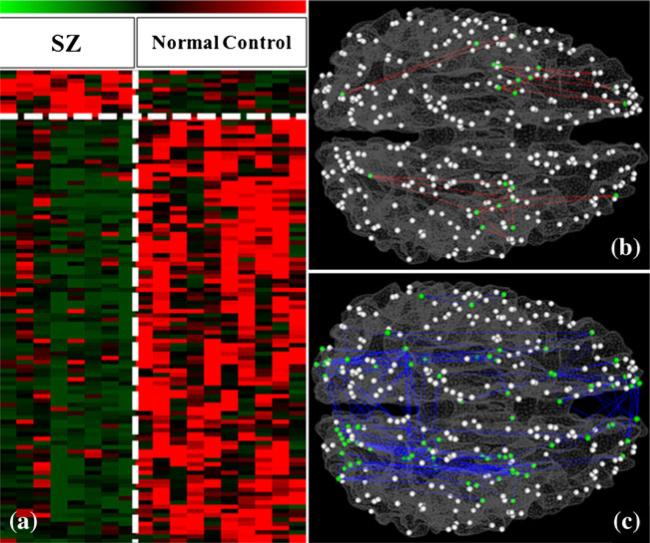
Fig. 8.
FGFI signatures for characterization of SZ when the clique size is 3. a The PFSs of the clustered cliques. Green and red stand for lower and higher PFSs, respectively. We identified 11 cliques showing consistently increased PFS and 100 cliques showing consistently decreased PFS in SZ group, compared with the normal control group. The vertical white dashed line separates SZ and controls, while the horizontal dashed white line separates significantly increases and decreased PFSs in SZ. The spatial distributions of these cliques on the cortical surface are shown in b for increased PFSs and c for decreased PFSs

