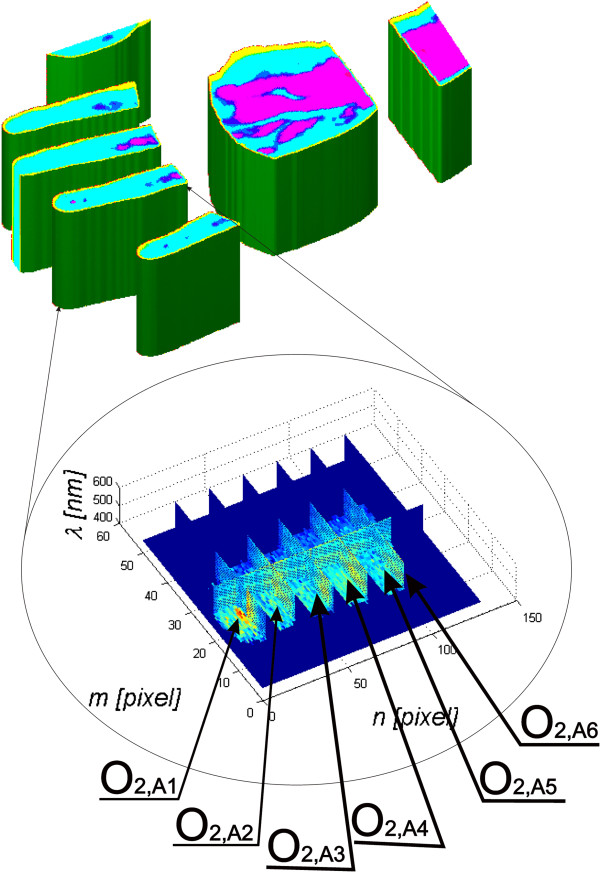
Figure 6.
Contours of melanin and haemoglobin images presented as components R-red and G-green respectively. For melanin, it is the contour formed as the sum of hyperspectral images in the frequency range λE∈(450,600) nm, whereas for haemoglobin this is the range λH∈(350,500) nm. Within these ranges, there are 189 images LP*(m,n,λ) for melanin and 126 images for haemoglobin. The image for melanin and the result of automatic segmentation into characteristic areas, described in the paper, are shown on top and separation into individual objects at the bottom.

