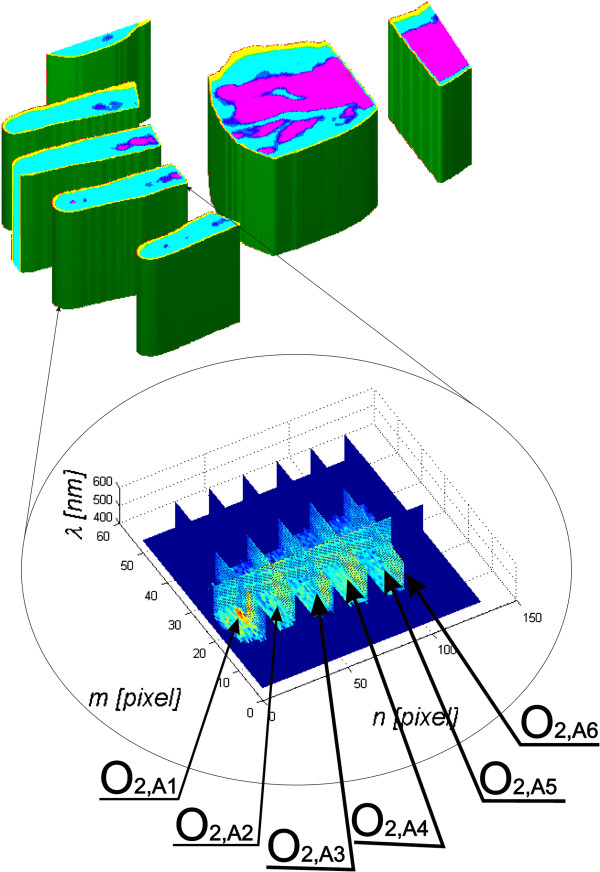
Figure 7.
Result of segmentation for individual wavelengths. The sample finger (V2) was divided into six areas from O2,A1 to O2,A6 for the left side and from O2,B1 to O2,B6 for the right side. Within these areas, the mean value of melanin and its standard deviation and proportions relative to the other areas are calculated.

