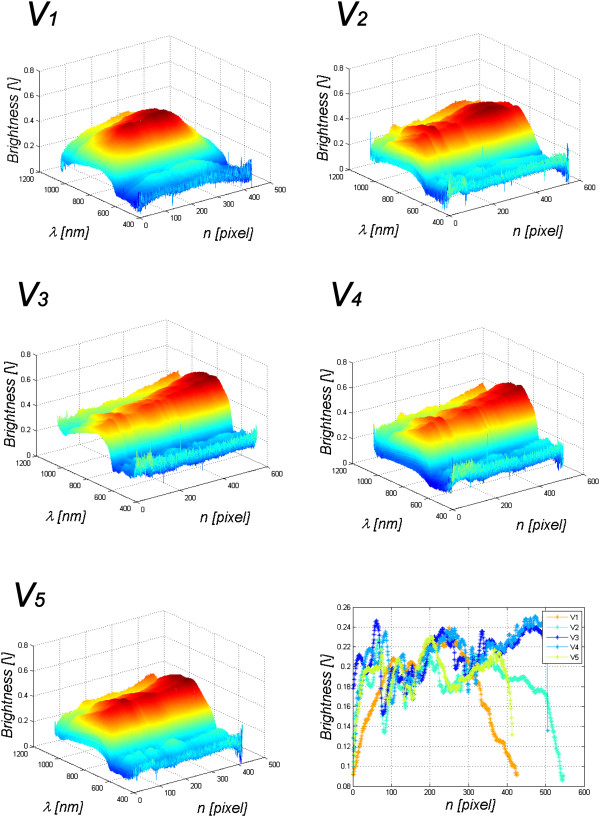
Figure 8.
Graphs of changes in the value of spectrum for wavelengths λ for the patient’s subsequent fingers. The values on the axes are successive columns, wavelength λ and brightness for the selected wavelength. The last sixth graph shows the change of melanin along all five fingers of the patient. The y-value is the mean value of brightness for λE∈(450,600) nm. The colours of individual lines correspond to the colours of the fingers shown at the bottom in Figure 6.

