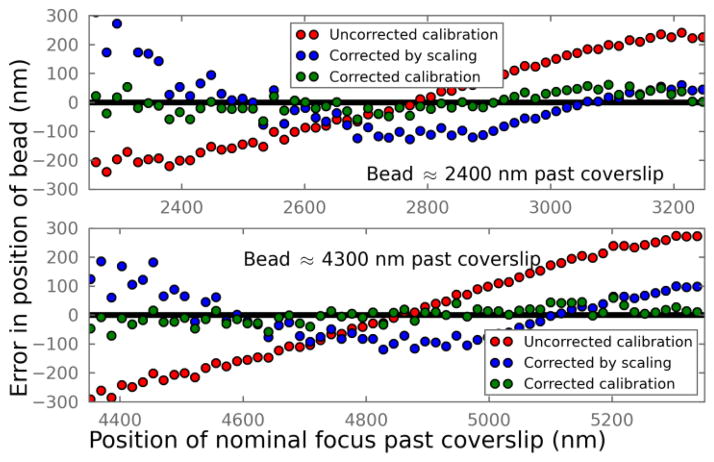
Fig. 2.
Error in determined z positions of agarose-embedded beads that are physically about 2400 nm and 4300 nm past the coverslip. The difference between the calculated and the actual z positions of the beads are plotted. Red: directly using the uncorrected calibration curve acquired at the surface; Blue: after scaling the z coordinates as described in [12]; Green: using calculated, aberration-corrected calibration curves at the corresponding depths.

