
Figure 3.
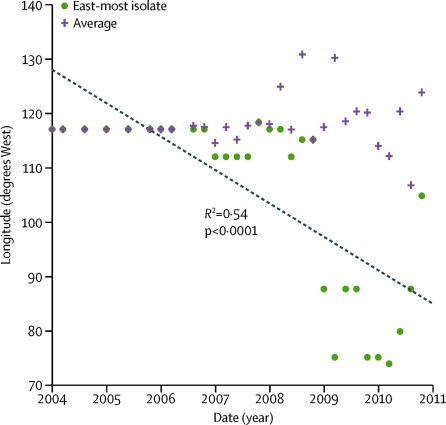
Longitude of Neisseria gonorrhoeae from samples and inferred locations in reconstructed phylogeny
Nodes from figure 2 are plotted using 2-month windows. Linear regression is for east-most longitude by date.
Official websites use .gov
A
.gov website belongs to an official
government organization in the United States.
Secure .gov websites use HTTPS
A lock (
) or https:// means you've safely
connected to the .gov website. Share sensitive
information only on official, secure websites.
Longitude of Neisseria gonorrhoeae from samples and inferred locations in reconstructed phylogeny
Nodes from figure 2 are plotted using 2-month windows. Linear regression is for east-most longitude by date.