Figure 1.

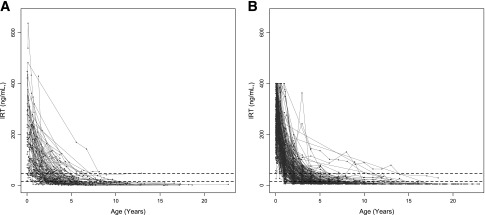
Longitudinal IRT trajectories for each participant in the Canadian (A) (n = 126) and Colorado (B) (n = 260) samples. Dotted lines represent the normal range of IRT measurement in the non-CF population (14.6–46.5 ng/mL).

Longitudinal IRT trajectories for each participant in the Canadian (A) (n = 126) and Colorado (B) (n = 260) samples. Dotted lines represent the normal range of IRT measurement in the non-CF population (14.6–46.5 ng/mL).