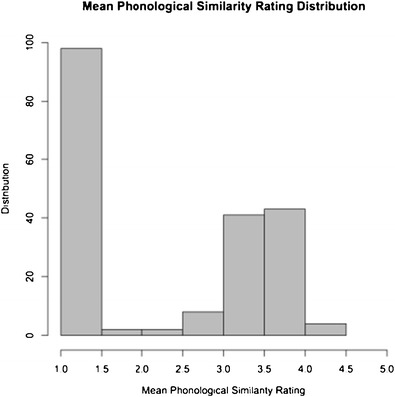
Fig. 1.

Distribution of mean P similarity ratings for all items. The x-axis shows the mean ratings on a 5-point scale, with 1 being completely different and 5 being identical. The y-axis shows the number of translation pairs that fall into each mean rating band
