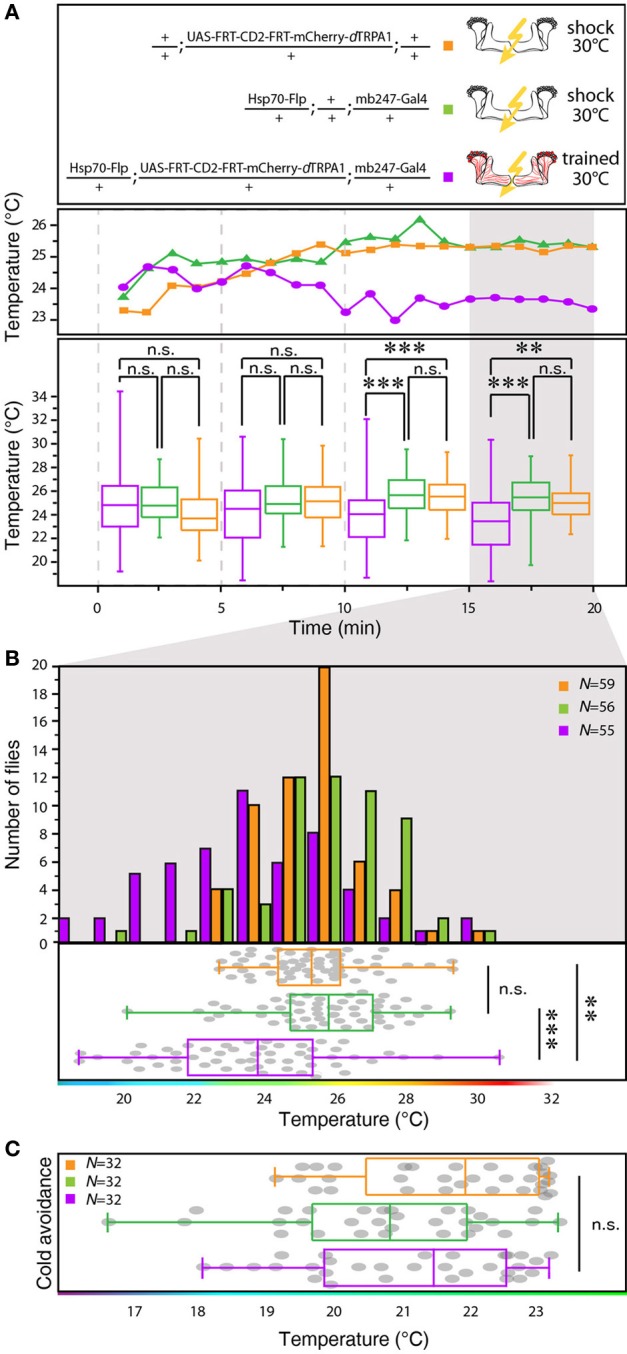
Figure 4.

Between-genotype comparison of mCherry-dTRPA1 expressing flies and genetic control animals. (A) Flies expressing mCherry-dTRPA1 in random ensembles of Kenyon cells show a shift in temperature preference when trained at 30°C for 2 min simultaneously with electric shocks compared to heterozygous control flies carrying the UAS-FRT-CD2(stop)-FRT-mCherry-dTRPA1 construct and heterozygous control flies carrying the Hsp70-Flp and the mb247-Gal4 constructs. The traces show the median temperature preference over time in 60 s bins during the 20 min test phase. The lower part of the graph shows temperature preferences in 5 min bins during the 20 min test phase. A significant change in temperature preferences is observed after ~10 min. Box plots indicate medians and interquartile ranges, minimum and maximum values. (B) Temperature preference of each genotype within the last 5 min of the 20 min test phase. Bars indicate the numbers of flies with a preference for the temperature range in 1°C bins indicated on the x-axis. The dots indicate temperature preferences of all individual flies. The superimposed lines indicate medians and interquartile ranges. Whiskers indicate minimum and maximum values. (C) After training at 30°C flies expressing mCherry-dTRPA1 in random ensembles of Kenyon cells no significant difference in avoidance of cool temperatures is observed between genotypes. Statistical test: Kruskal-Wallis-test with Bonferroni-corrected post-hoc Mann-Whitney-U-test (**p < 0.01; ***p < 0.001).
