Figure 5.
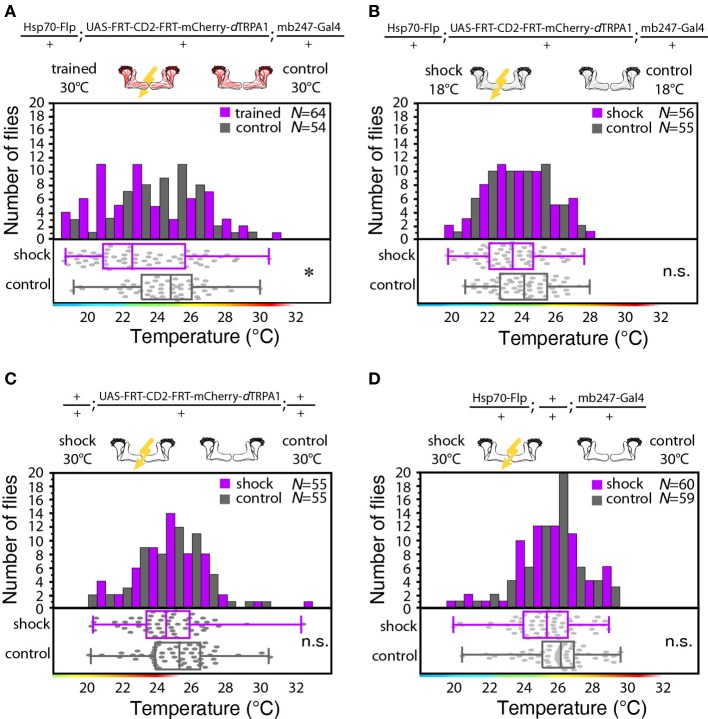
Thermogenetic induction of learning. (A) Temperature preferences of trained and control flies that express mCherry-dTRPA1 in random ensembles of Kenyon cells. Flies trained at 30°C show a significant (p < 0.02) shift in temperature preference compared to control animals, i.e., animals that did not receive electric shocks. (B) Temperature preference of flies that express mCherry-dTRPA1 in random ensembles of Kenyon cells treated with or without electric shocks at 18°C. No significant (p > 0.08, Mann-Whitney-U-test) difference in the temperature preference between trained flies and control flies is detectable. (C) Temperature preference of flies heterozygous for the UAS-FRT-CD2(stop)-FRT mCherry-dTRPA1 DNA construct treated with or without electric shocks at 30°C. No significant (p > 0.2) differences in the temperature preference between trained flies and control flies is detectable. (D) Temperature preference of flies heterozygous for the Hsp70-Flp and the mb247-Gal4 DNA constructs treated with or without electric shocks at 30°C. No significant (p > 0.05) differences in the temperature preference between trained flies and control flies is detectable. In panels (A–D) bars indicate the numbers of flies with a preference for the temperature range indicated on the x-axis in 1°C bins. The dots indicate temperature preferences of all individual flies. The superimposed lines indicate medians and interquartile ranges. Whiskers indicate minimum and maximum values. Statistical test: Mann-Whitney-U-test with Bonferroni correction. (*p < 0.05).

