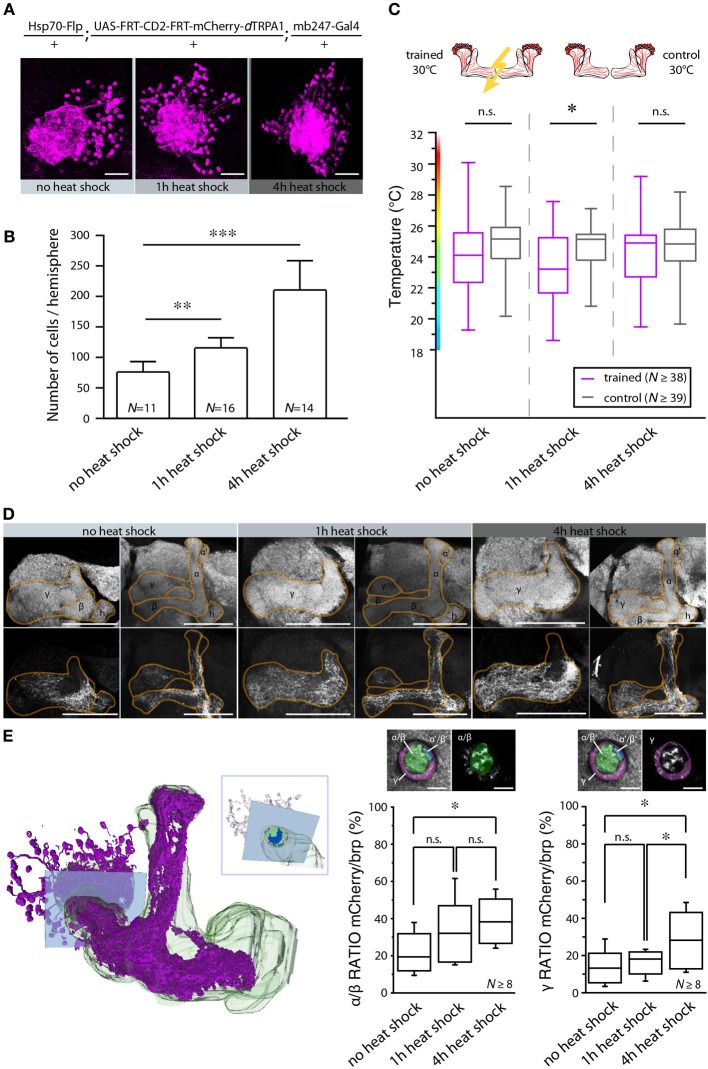
Figure 9.
The number of activated Kenyon cells affects the learning ability. (A) Representative images of mushroom body calyces from flies receiving no heat shock, 1 or 4 h of heat shock during development to induce the expression of mCherry-dTRPA1. Scale bars = 30 μm. (B) Prolonging the heat shock during development causes an increase in the number of Kenyon cells expressing mCherry-dTRPA1 (**p < 0.01; ***p < 0.001. One-Way ANOVA). Bars indicate means ± SD. (C) Temperature preference of flies that express mCherry-dTRPA1 in ensembles of Kenyon cells and that have been treated at 30°C with electric shocks (“trained”) in comparison to flies that have not received electric shocks (“control”). The three groups differ in the duration of the gene expression induction and the number of Kenyon cells expressing mCherry-dTRPA1, as indicated in (B). The graphs indicate medians, interquartile ranges, minimum and maximum values. A significant shift in temperature preference during the test situation is detected only in animals that have received a 1 h induction of gene expression during development when compared to control flies (p < 0.05). There is no significant difference in temperature preference in flies that have not received any heat shock (p > 0.1) or that have received a 4 h heat shock during development (p > 0.9) compared to the respective controls. Statistical test: bonferroni-corrected Mann-Whitney-U-test. (*p < 0.05). (D) Representative images of α/β- and γ-lobe mushroom body lobes of flies that have received no heat shock, 1 or 4 h of heat shock during development to induce the expression of mCherry-dTRPA1. Scale bars = 50 μm. (E) Left: 3D reconstruction of the mushroom bodies and Kenyon cells expressing mCherry-dTRPA1 (4 h heat-shock during development). The inlet indicates a focal plane (blue rectangle) at a region of the peduncle in which α/β- and γ –lobes can be anatomically differentiated. Right: quantification of area within the subregions of the peduncle that shows mCherry-dTRPA1 expression normalized to the total area determined by anti-bruchpilot (brp) staining. Prolonging the heat shock during development causes an increase in the relative area occupied by Kenyon cells expressing mCherry-dTRPA1 within the focal plane (*p < 0.05; One-Way ANOVA, N ≥ 8 mushroom bodies from 5 to 7 animals). Scale bars = 10 μm.

