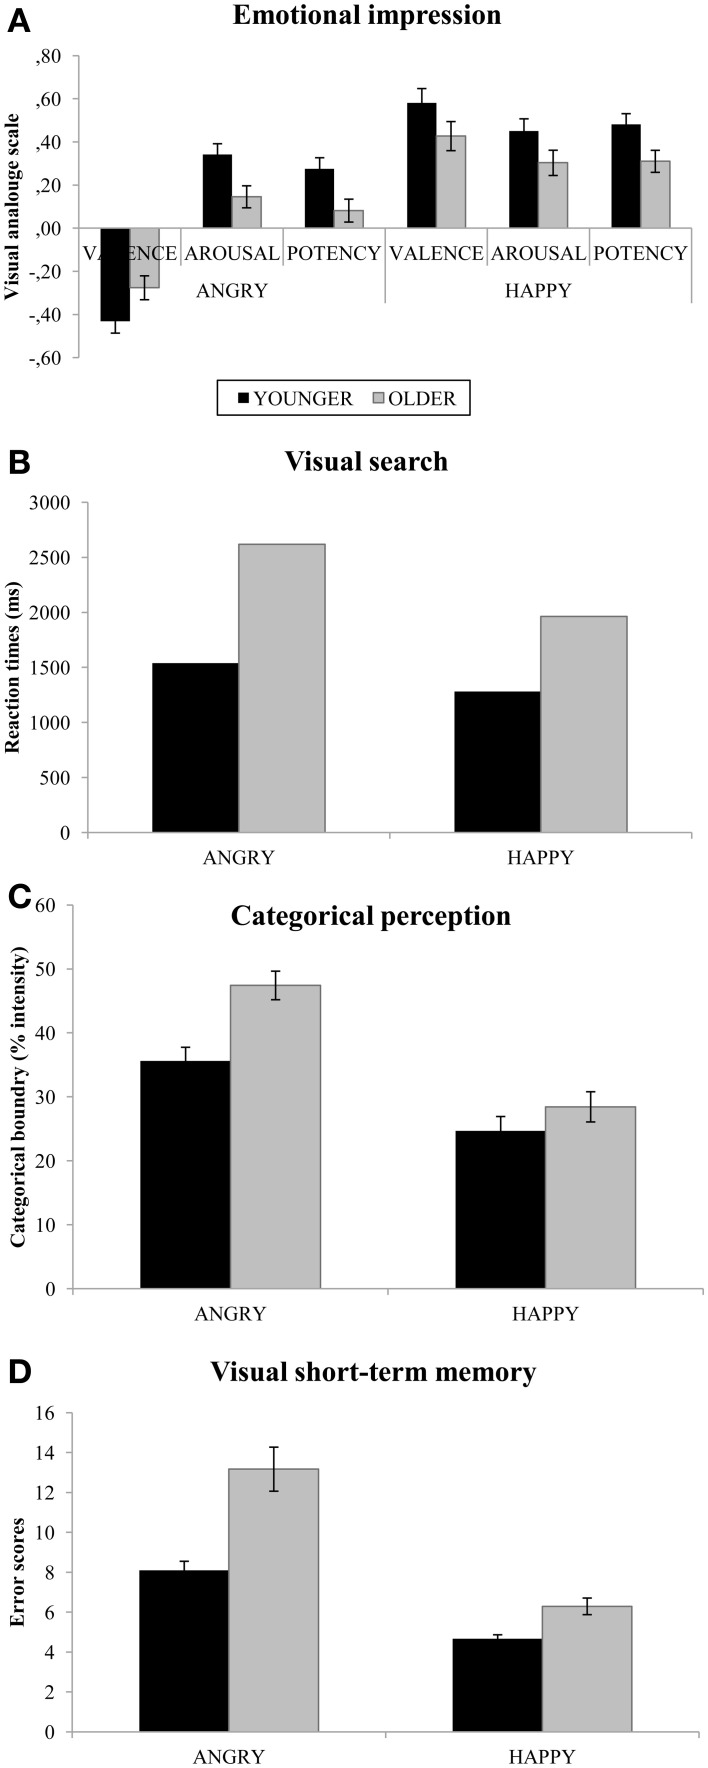
Figure 3.
Mean (SE) performance in the rating task (A), visual search task (B), categorical perception task, (C) and visual short-term memory task (D) separately for expression and age. Note. Error bars represent standard error. Results of the ANOVAs and t-tests for age differences are presented in the result section.

