
Figure 2.
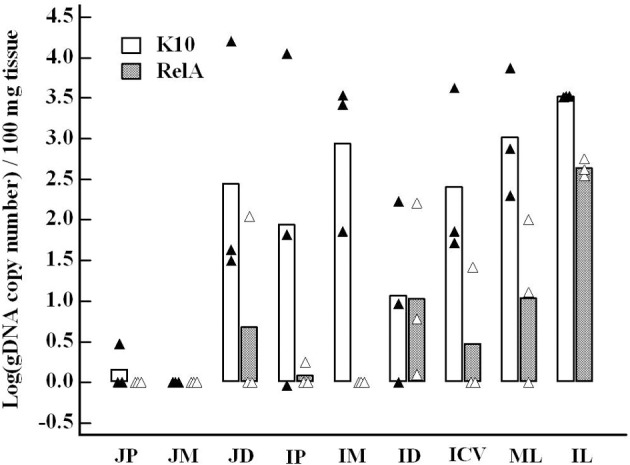
Comparison of bacterial loads in each tissue site between K10 and RelA groups. Map gDNA copy number per 100 mg tissue of each sample measured by IS900 qPCR was transformed to a log scale. The results were compared for the same tissue site between the two groups. Data are presented as the average of three animals of each group (bar graph) with all individual data (K10 group, closed triangle, and RelA group, open triangle, respectively). JP, JM, JD: jejunum proximal, middle, distal; IP, IM, ID: ileum proximal, middle, distal; ICV: ileocecal valve; ML, IL: mesenteric and ileocecal lymph nodes. The bacterial loads in IM and IL were statistically significant between the two groups (p < 0.05).