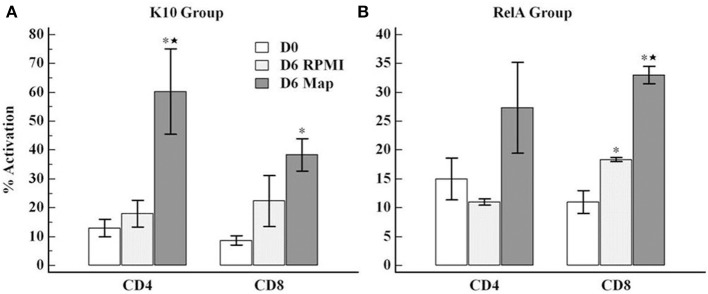
Figure 4.

Flow cytometric analysis of the proliferative response of PBMC cultured ex vivo in absence/presence of live Map. The figure shows the frequency of activated CD4 (CD4/CD25/CD45R0 positive) or CD8 (CD8/CD25/CD45R0 positive) cells obtained with PBMC from the K10 group (A) and the relA group (B). The data represent the mean percent activation of CD4 and CD8 T cells with error bar (SE). D0, PBMC at day 0; D6 rpmI and D6 Map, PBMC cultured in medium alone and with live Map for 6 days, respectively; * and ⋆, significant difference compared to D0 and D6 rpmI, respectively (p < 0.05).
