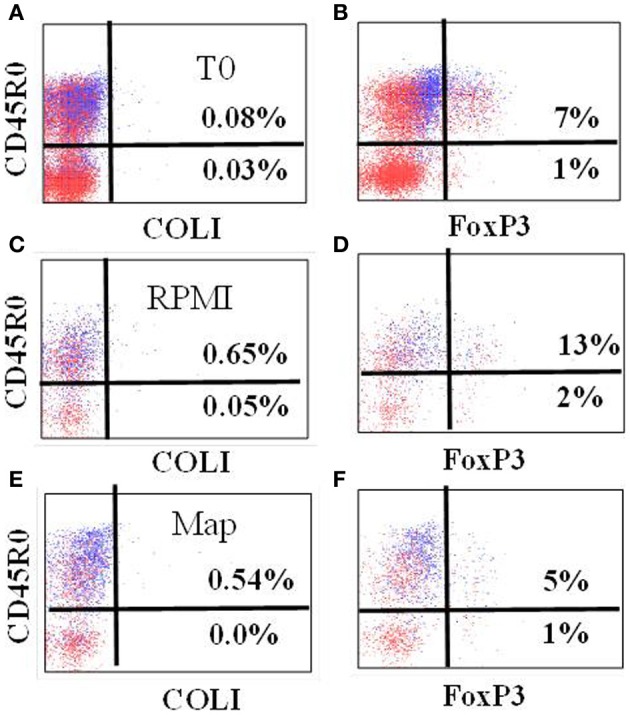
Figure 6.

Representative profiles showing expression of FoxP3 in gated CD4 T cells at T0 (A,B), and cultured in RPMI alone (C,D) and stimulated with live Map (E,F) from a calf of RelA group. As noted, use of anti-CD45R0 rather than anti-CD25 provides better resolution of cells expressing FoxP3. COLI = isotype control.
